

Why load testing never makes it into CI
In most teams, load testing is a pre-release ritual: a separate tool, a separate person, a separate PDF that nobody opens after the release call. This isn’t a tooling gap. Load testing fails to meet the three things CI demands from everything it runs, and a pipeline step that fails all three gets quarantined.
Fast. A CI step that blocks a merge has a budget measured in minutes. A meaningful load test ramps up, holds a plateau, and ramps down — that’s twenty minutes at the low end, hours for a soak test. You cannot put that in front of a pull request without destroying the merge cadence.
Deterministic. A functional test is a comparison against an expected value. A load test is a measurement, and measurements drift. The same script against the same build gives you a different p95 depending on whether the database was warm, whether another team was deploying to the shared staging environment, and whether the autoscaler had already added the second pod. CI treats a non-deterministic result as a broken step and people start clicking “re-run.”
Automatically interpretable. A functional test ends in pass or fail. A load test ends in a distribution. Turning “p95 went from 380 ms to 445 ms” into a merge decision requires a threshold, and most teams never define one — so the result is handed to a human, which means it’s handed to nobody.
Anything you do to put load testing into CI is an answer to these three constraints. Managed load generation answers part of the first one. The other two are still your job.
What BrowserStack Load Testing actually solves
BrowserStack Load Testing is managed load generation: you bring an existing k6 or JMeter script, it runs that script distributed across cloud machines in multiple regions, and it exposes a CLI and API so a CI job can trigger a run and read back the result. There is no new scripting language to learn — that’s deliberate, and it’s the point.
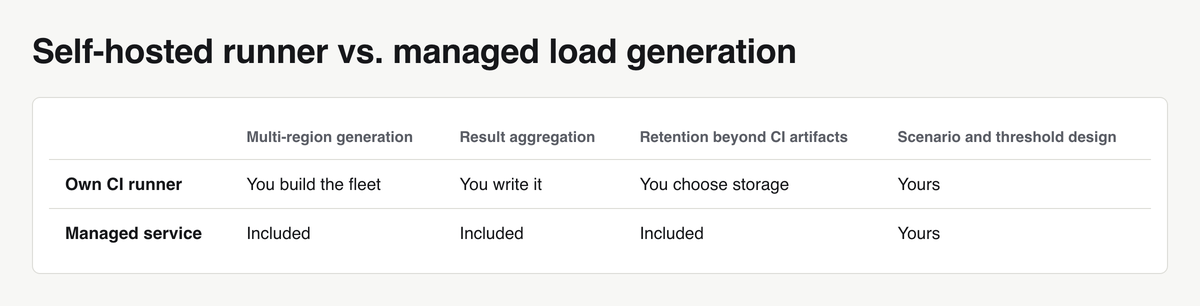
The value isn’t the load model. It’s that you stop owning load generation infrastructure. No runner fleet to provision, no node-to-node result aggregation to write, no storage decision about where last month’s runs live, no argument with the platform team about why QA needs sixteen egress IPs.
What it does not solve, and what no vendor solves for you:
- Scenario design. Whether your script represents real traffic is a modelling question. A thousand VUs hammering
/healthis a load test that tests nothing. - Test data. Unique users, unique carts, unique order IDs per virtual user — you build that.
- Thresholds. The tool reports p95. Deciding that 500 ms is a failure and 450 ms is a warning comes from your SLO, not from a dashboard.
- The environment under test. If staging is one-tenth of production, the numbers are directionally useful at best.
Buying managed load generation while skipping those three gives you expensive noise.
Managed load generation vs. running your own infrastructure
Running your own k6 or JMeter runner is cheap right up until it isn’t. The hidden line items:
Single-machine ceilings. One box has a finite number of ephemeral ports, a finite CPU budget for TLS handshakes, and a NIC that saturates. Protocol-level tools like k6 are efficient, but as soon as the script does heavy JSON parsing, per-iteration crypto, or holds many open connections, the generator starts queueing and you begin measuring your own runner instead of the system under test. The tell is that reported latency rises while server-side metrics stay flat.
CI runners are the wrong hardware. Hosted CI runners are provisioned for compiling and running unit tests: modest vCPU, shared network, no guarantee about noisy neighbours. They are also sized identically for every job, which means your load numbers inherit whatever the provider’s current instance class happens to be. Any run-over-run comparison across a runner image upgrade is suspect.
Geographic distribution. If your users are on three continents and your generator is in one region, TLS setup and RTT are constants you’ve baked into every measurement. Multi-region generation is not hard conceptually; it’s hard operationally, because now you’re running a fleet.
NAT and IP limits. All traffic from one runner leaves from one IP. Your WAF, rate limiter, or bot-detection layer sees a single source doing 2,000 requests per second and does exactly what it was configured to do. You then spend a sprint writing allow-list rules that make the test less representative of reality.
Result collection and retention. Aggregating per-node output into one percentile set is a correctness problem, not a formatting problem — you cannot average p95s across nodes. Then you need those results stored somewhere queryable for more than the seven days your CI keeps artifacts.
A managed service deletes the fleet, the aggregation code, the multi-region orchestration, and the retention problem. It converts them into a monthly invoice. It does not delete the WAF conversation (distributed source IPs change the shape of that problem, not its existence), the scenario design, or the cost of a realistic staging environment — which is usually the bigger bill.
Where load tests belong in the pipeline
Running a full load test on every pull request is theatre; running it never is negligence. Three tiers, each with a different question:
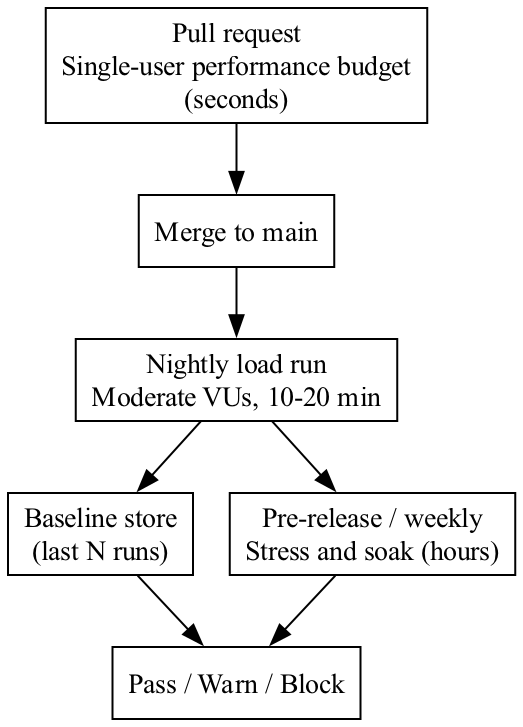
Tier 1 — pull request, single user, seconds. One virtual user, a handful of iterations, a hard budget on response time and payload size for the endpoints the PR touched. This catches the N+1 query, the accidentally removed index, the newly added synchronous call to a third party. It catches nothing about concurrency, locking, or connection pool exhaustion — by design.
Tier 2 — nightly, moderate load, minutes. Your realistic peak traffic shape against the latest main build. This catches pool saturation, queue growth, cache behaviour under repetition, and slow regressions in the tail. It misses anything that only appears after hours of uptime: memory leaks, log-volume disk pressure, connection churn.
Tier 3 — pre-release or weekly, stress and soak, hours. Push beyond expected peak until something breaks, and separately hold steady load for several hours. This finds the breaking point and the leaks. It is too slow and too expensive to gate anything, so it produces a report and a ticket, not a red build.
The managed service is worth money at tiers 2 and 3. Tier 1 runs fine on the CI runner you already pay for.
Wiring an existing k6 scenario into CI
The script defines thresholds, which makes k6’s exit code meaningful: non-zero when a threshold is breached. The CI step then needs no cleverness — it just doesn’t swallow the exit code.
load/checkout.js:
import http from 'k6/http';
import { check, sleep } from 'k6';
import { Trend, Rate } from 'k6/metrics';

const checkoutDuration = new Trend('checkout_duration', true);
const checkoutErrors = new Rate('checkout_errors');

const BASE_URL = __ENV.BASE_URL || 'https://staging.example.com';

export const options = {
  stages: [
    { duration: '1m', target: 50 },   // ramp up
    { duration: '5m', target: 50 },   // plateau
    { duration: '30s', target: 0 },   // ramp down
  ],
  thresholds: {
    // Ignore the ramp-up window: only the plateau is judged.
    'http_req_failed': ['rate<0.01'],
    'checkout_errors': ['rate<0.01'],
    'checkout_duration': ['p(95)<800', 'p(99)<1500'],
    'http_reqs': ['rate>20'],
  },
  summaryTrendStats: ['avg', 'min', 'med', 'p(95)', 'p(99)', 'max'],
};

export function setup() {
  const res = http.post(`${BASE_URL}/api/test-support/seed-users`, JSON.stringify({ count: 50 }), {
    headers: { 'Content-Type': 'application/json' },
  });
  if (res.status !== 201) {
    throw new Error(`Seeding failed: ${res.status} ${res.body}`);
  }
  return { users: res.json('users') };
}

export default function (data) {
  const user = data.users[__VU % data.users.length];

  const login = http.post(`${BASE_URL}/api/login`, JSON.stringify({
    email: user.email,
    password: user.password,
  }), { headers: { 'Content-Type': 'application/json' } });

  const ok = check(login, { 'login 200': (r) => r.status === 200 });
  if (!ok) {
    checkoutErrors.add(1);
    sleep(1);
    return;
  }

  const token = login.json('token');
  const authHeaders = {
    headers: { 'Content-Type': 'application/json', Authorization: `Bearer ${token}` },
  };

  const cart = http.post(`${BASE_URL}/api/cart`, JSON.stringify({ sku: 'SKU-1001', qty: 1 }), authHeaders);
  const checkout = http.post(`${BASE_URL}/api/checkout`, JSON.stringify({ cartId: cart.json('id') }), authHeaders);

  checkoutDuration.add(checkout.timings.duration);
  checkoutErrors.add(checkout.status !== 201);

  check(checkout, { 'checkout 201': (r) => r.status === 201 });
  sleep(Math.random() * 2 + 1);
}
GitHub Actions workflow, .github/workflows/load-nightly.yml:
name: Nightly load test

on:
  schedule:
    - cron: '0 2 * * *'
  workflow_dispatch:

jobs:
  load:
    runs-on: ubuntu-latest
    timeout-minutes: 30
    env:
      BASE_URL: https://staging.example.com
      BROWSERSTACK_USERNAME: ${{ secrets.BROWSERSTACK_USERNAME }}
      BROWSERSTACK_ACCESS_KEY: ${{ secrets.BROWSERSTACK_ACCESS_KEY }}
    steps:
      - uses: actions/checkout@v4

      - name: Install k6
        run: |
          sudo gpg -k
          sudo gpg --no-default-keyring \
            --keyring /usr/share/keyrings/k6-archive-keyring.gpg \
            --keyserver hkp://keyserver.ubuntu.com:80 \
            --recv-keys C5AD17C747E3415A3642D57D77C6C491D6AC1D69
          echo "deb [signed-by=/usr/share/keyrings/k6-archive-keyring.gpg] https://dl.k6.io/deb stable main" \
            | sudo tee /etc/apt/sources.list.d/k6.list
          sudo apt-get update
          sudo apt-get install -y k6

      - name: Run load scenario
        id: load
        run: |
          mkdir -p results
          k6 run load/checkout.js \
            --summary-export=results/summary.json \
            --out json=results/raw.json

      - name: Compare against baseline
        if: always()
        run: node scripts/check-baseline.js results/summary.json baselines/checkout.json

      - name: Upload results
        if: always()
        uses: actions/upload-artifact@v4
        with:
          name: load-results-${{ github.run_number }}
          path: results/
          retention-days: 30
The credentials are injected as repository secrets, never as workflow inputs — a load-test token can start billable runs, so treat it like a deploy key. To execute the same script on managed infrastructure instead of the runner, you replace only the Run load scenario step with the vendor’s CLI invocation; the script, the thresholds, the artifact upload and the baseline comparison stay identical. Check the current CLI reference for the exact command and flags rather than copying them from a blog post — they change.
Setting thresholds: p95, error rate, or both
Average response time is useless as a CI gate. An endpoint that serves 95% of requests in 40 ms and 5% in 6 seconds has a fine average and a terrible user experience. Averages hide exactly the tail behaviour that load testing exists to find.
Gate on three metrics together, because each one alone can be gamed by the system under test:
- p95 and p99 latency — tail behaviour. p95 for the gate, p99 as a warning signal.
- Error rate — a service that sheds load under pressure gets faster while failing. Latency alone will not catch that.
- Throughput — if the generator couldn’t sustain the target request rate, your latency numbers describe a lighter test than you intended, and the run is invalid rather than green.
Where does the number come from? If you have an SLO, derive from it — a 99.5% availability and 500 ms p95 SLO gives you a p95 threshold below 500 ms with headroom. If you don’t, read your production telemetry’s current p95 for the same flow, add a tolerance band, and write that down as the starting point.
But an absolute number is brittle. It ages, it encodes whatever the staging environment was that month, and it gets bumped upward every time it fails until it means nothing. Comparing against a rolling baseline of the last N runs is more durable: it detects change rather than asserting an arbitrary constant, and it absorbs slow environment drift without a human editing a magic number.
scripts/check-baseline.js:
#!/usr/bin/env node
const fs = require('fs');

const [summaryPath, baselinePath] = process.argv.slice(2);
if (!summaryPath || !baselinePath) {
  console.error('usage: check-baseline.js <summary.json> <baseline.json>');
  process.exit(2);
}

const WINDOW = 10;          // runs kept in the baseline
const WARN_RATIO = 1.10;    // +10% over median baseline -> warn
const FAIL_RATIO = 1.25;    // +25% over median baseline -> fail
const MIN_RUNS = 5;         // below this, record only, never gate

const summary = JSON.parse(fs.readFileSync(summaryPath, 'utf8'));
const p95 = summary.metrics.checkout_duration['p(95)'];
const errorRate = summary.metrics.checkout_errors.rate;
const reqRate = summary.metrics.http_reqs.rate;

const history = fs.existsSync(baselinePath)
  ? JSON.parse(fs.readFileSync(baselinePath, 'utf8'))
  : [];

function median(values) {
  const sorted = [...values].sort((a, b) => a - b);
  const mid = Math.floor(sorted.length / 2);
  return sorted.length % 2 ? sorted[mid] : (sorted[mid - 1] + sorted[mid]) / 2;
}

let status = 'PASS';
let message = `p95=${p95.toFixed(1)}ms errors=${(errorRate * 100).toFixed(2)}% rps=${reqRate.toFixed(1)}`;

if (history.length < MIN_RUNS) {
  message += ` | baseline warming up (${history.length}/${MIN_RUNS} runs)`;
} else {
  const base = median(history.map((h) => h.p95));
  const ratio = p95 / base;
  message += ` | baseline p95=${base.toFixed(1)}ms ratio=${ratio.toFixed(2)}`;
  if (ratio >= FAIL_RATIO) status = 'FAIL';
  else if (ratio >= WARN_RATIO) status = 'WARN';
}

history.push({ timestamp: new Date().toISOString(), p95, errorRate, reqRate });
fs.mkdirSync(require('path').dirname(baselinePath), { recursive: true });
fs.writeFileSync(baselinePath, JSON.stringify(history.slice(-WINDOW), null, 2));

console.log(`${status}: ${message}`);

if (process.env.GITHUB_STEP_SUMMARY) {
  fs.appendFileSync(process.env.GITHUB_STEP_SUMMARY, `**Load test: ${status}**\n\n${message}\n`);
}

process.exit(status === 'FAIL' ? 1 : 0);
Note the MIN_RUNS guard: a baseline with two samples is not a baseline, and gating on it produces exactly the arbitrary failures that get load testing removed from CI.
What makes load tests flaky and how it shows up in CI
Functional flakiness is usually the test’s fault — a race condition in the assertion, a selector that resolves before hydration. In load testing it’s usually the environment’s fault, which means the fix lives outside the script. The diagnostic discipline is the same as for root-causing unstable Playwright tests: separate what varies from what stays constant, then look at the layer that varies.
Shared staging. Another team deploys mid-run and your p95 doubles. Mitigation: take an advisory lock on the environment for the duration of the run, or run against an ephemeral environment provisioned per run. If neither is possible, record a deploy marker and invalidate runs that overlap one.
Cold start and autoscaling lag. The first ninety seconds measure an undersized cluster scaling up. Mitigation: add an explicit warm-up stage, and exclude the ramp-up window from the judged metrics. In the script above that’s what the gradual stages plus a custom trend accomplish — but if your platform scales slowly, extend the warm-up rather than lengthening the plateau.
Rate limits and WAF. Suddenly 30% of responses are 429 or 403 and your error-rate threshold fires. Mitigation: either allow-list the generation source, or — better — set the test’s target rate below the production rate limit so the limiter stays out of the measurement. If you want to test the limiter, that’s a separate scenario with its own thresholds.
Database bloat from previous runs. Run fifty nightly tests that each insert ten thousand orders and run fifty-one gets slower than run one for reasons that have nothing to do with the code. Mitigation: reset the dataset or use a fresh namespace per run.
CDN and cache warming. The first run after a deploy measures cache misses. Mitigation: a short warm-up pass over the hot paths before the measured phase begins.
Every one of these produces the same symptom — a red build nobody believes — and every one of them is fixed by changing the run conditions, not the assertions.
Test data and isolation: a harder problem under load
The fixed test user that works perfectly with five virtual users becomes lock contention at five hundred. Five hundred VUs logging in as te**@*****le.com serialize on the same session row, the same cart, the same account balance. You then measure your database’s row-lock behaviour and report it as application latency.
Load testing inherits the rule that every test must produce its own data, but with three differences:
Bulk generation in setup, not per iteration. Creating a user inside the default function makes user creation part of your measured workload. Generate the pool once in setup() — as the script above does — and hand it to the VUs.
Unique identity per VU, not per iteration. k6 gives you __VU; use it to index into the pre-generated pool so each virtual user owns a distinct identity for the whole run. Per-iteration uniqueness creates unbounded data growth; per-VU uniqueness is bounded by the concurrency.
Cleanup is a load problem in itself. Deleting four hundred thousand rows after a run can take longer than the run. At that point, stop cleaning up: give the load test its own tenant, schema, or namespace and drop the whole thing. That’s cheaper than a teardown phase and it removes the cross-run bloat failure mode at the same time. Use targeted cleanup only when the test must share a dataset with something else — which, for a load test, it shouldn’t.
Not leaving results open to interpretation: reporting and the pass/fail decision
A load test report that nobody reads does not exist. Reduce CI’s output to three states and make each one surface somewhere a human already looks.
Pass — within baseline tolerance. Writes a line to the job summary. Nobody is notified.
Warn — regression above the warning ratio but below the failure ratio, or p99 degraded while p95 held. Posts a comment on the PR, or a message to the team channel for nightly runs, naming the metric, the current value, the baseline value, and a link to the stored artifact. A warning exists to start a conversation this week, not to block anything.
Block — regression past the failure ratio, error-rate threshold breached, or throughput target missed. Red build.
The question of whether tier-2 results should block is where most teams get stuck. The typical pattern that survives contact with a real team: start in warn-only mode, let the baseline accumulate, and only enable blocking once the gate has produced no false positives for a couple of weeks. Turning on blocking before the baseline is stable is how load testing gets removed from the pipeline — not because the measurement was wrong, but because the first three red builds were all environment noise and the team learned to ignore the step.
Finally: a trend chart beats a single-run report, always. One run tells you a number; twenty runs tell you whether the number is moving. The rolling baseline file in the script above is the minimum version of this — it’s a committed, reviewable record of how your p95 has moved over the last ten runs, and it makes the regression visible in a diff.
When you don’t need this product
Honest boundary. Managed load generation is burning money if:
- A few hundred VUs from a single region covers your traffic. A single well-provisioned machine running k6 handles a substantial VU count for protocol-level HTTP work. Measure your own ceiling rather than guessing: ramp the generator while watching its CPU, and find the point where generator-side CPU saturates or reported latency rises while server-side latency doesn’t. Below that point, you don’t need a fleet.
- You run load tests monthly. A subscription for twelve runs a year is worse than a spot VM you start by hand.
- You already know the bottleneck is the database. Then your next step is query analysis and index work, not more concurrent users. Load testing confirms a hypothesis you already hold; it doesn’t generate the fix.
- Your staging environment isn’t production-shaped. Load numbers from a one-pod staging cluster tell you about the one-pod staging cluster. Fix the environment first.
You’ve crossed the threshold when: your target load exceeds what one generator can sustain without becoming the bottleneck; your users are distributed across regions and RTT materially changes the result; your security layer forces you to choose between a realistic test and a single allow-listed IP; or you need run history retained and queryable beyond what CI artifacts give you. Any two of those together and building it yourself stops being the cheap option.
What to do this week
- Pick one user flow — the single flow whose failure costs the most. Not the whole application. Checkout, search, login, whichever one is load-bearing for the business.
- Measure that flow’s current p95 in production from your APM or access logs. Write it in the repository as a comment next to the threshold. Without this number, every threshold you set is invented.
- Write a k6 script for that flow with thresholds on p95, error rate, and throughput, and with per-VU data generated in
setup(). - Run it nightly against staging, warn-only. No blocking. Upload the summary as an artifact and append the result to a committed baseline file.
- After two weeks, look at the baseline file. If the spread across runs is tight, tighten the thresholds and turn on blocking. If it’s wide, fix the environment — that spread is your flakiness, and no threshold will survive it.
Enable the gate only after the baseline is stable. A load test that blocks merges before it can measure reliably teaches the team to distrust it, and you only get to introduce it once.